Reducing AWS S3 .NET LOH allocations by 98%
One of the things we do at Codeweavers is help people find their next vehicle. That usually involves customers seeing what vehicle they are buying - I mean, would you buy a car without seeing what it looks like? The application that holds this responsibility is the worst offender for obscene amounts of allocations, time spent in GC, and generally eating RAM like the Cookie Monster eats well…cookies.
Every now and then we like to take a memory dump of this application from our production environment. We have done this enough times that we have automated the most common diagnostics steps we take and bundled them into a little tool1 called ADA (Automated Dump Analysis). If you are interested you can find the tool here and all the code talked about in this article here.
One of the analysers that we run is to dump all the
byte[] arrays found on the Large Object Heap (LOH). After
running that analyser against our eight gigabyte memory dump, we found
several hundred byte[] arrays with a length of
131,096 or 131,186. Well that is pretty odd.
Opening some of the files in Notepad++ just presented us
with lots of random characters.
Throwing the scientific
method out of the window for a second, I decided to mass rename all
the dumped byte[] arrays to *.jpg - hey presto
some of the files were now displaying thumbnails! On closer inspection,
around 50% of the files were images. The other 50% failed to open as an
image at all. Opening a handful of the non-image files in Notepad++
showed that they all had a line similar to this right at the beginning
of the file:-
0;chunk-signature=48ebf1394fcc452801d4ccebf0598177c7b31876e3fbcb7f6156213f931b261dOkay, this is beginning to make a little more sense. The
byte[] arrays that have a length of 131,096
are pure images. The byte[] arrays that are not images have
a length of 131,186 and have a chunk-signature
line before the rest of the contents. I would guess the
signature is a SHA256 hash of the contents.
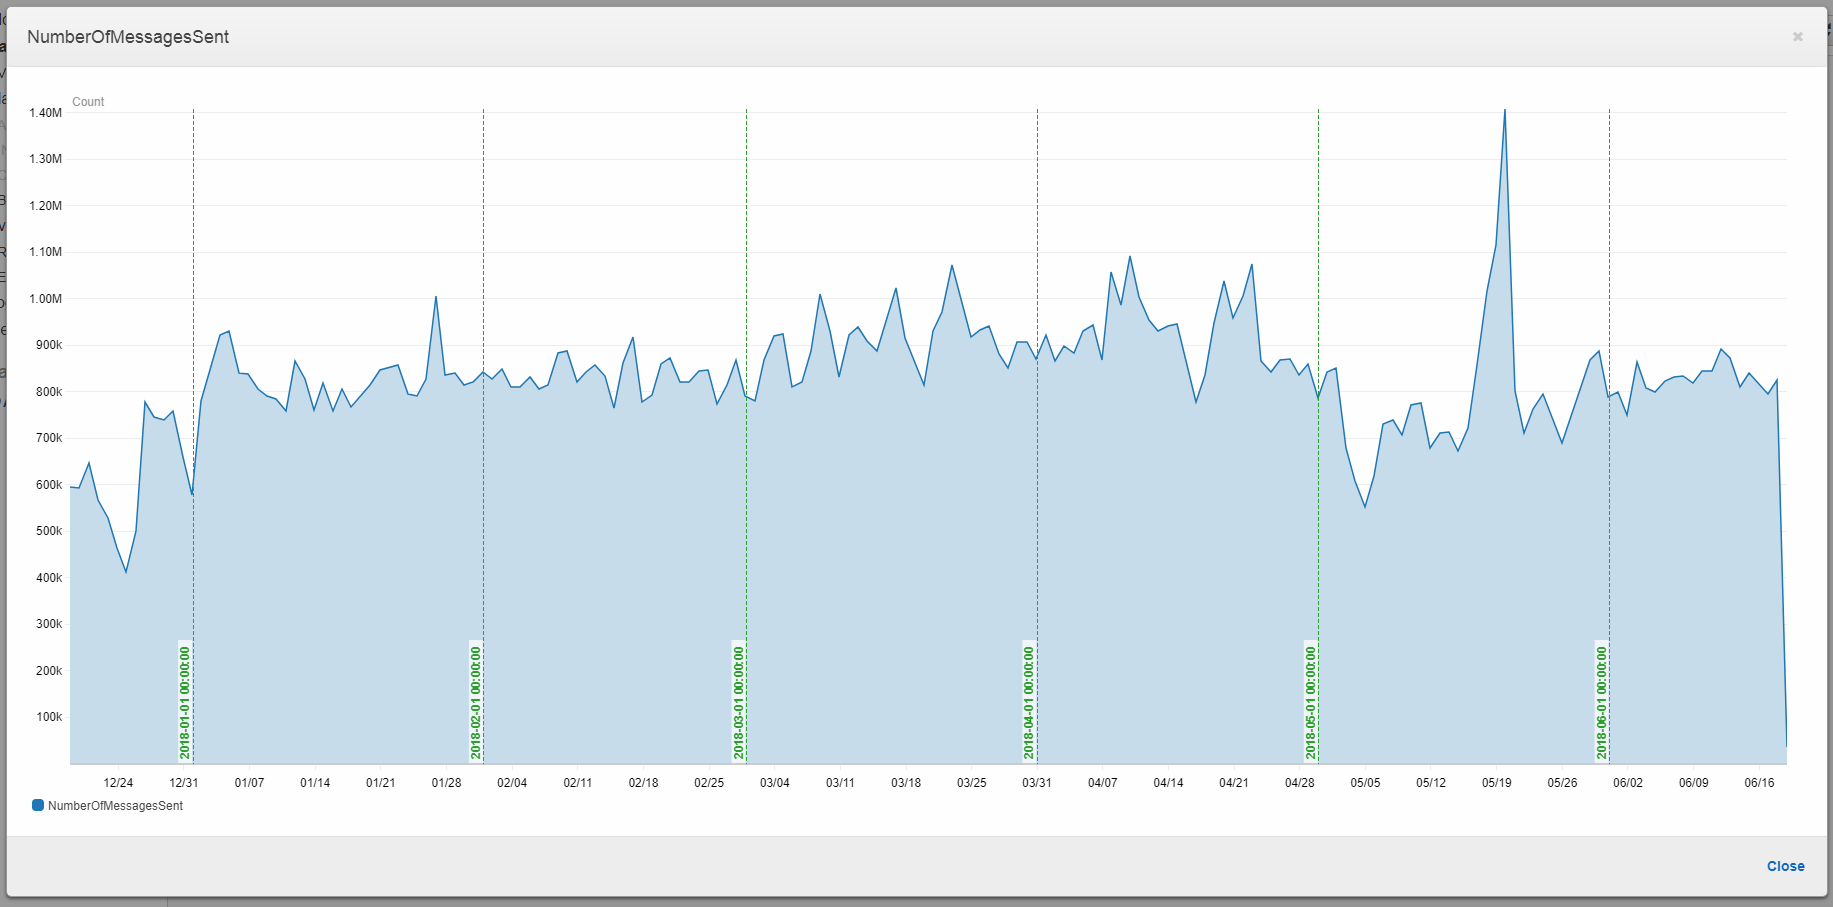
Before we go any further, it is worth establishing how busy this application is with image processing. All of our image processing is distributed across our farm using AWS SNS and SQS. Using CloudWatch Metrics we can see that easily:-

Okay, so fairly busy. It is worth noting that before any performance centric work is carried out, always establish how often the code is hit and the current costs. If a code path has a high cost (e.g. takes twenty seconds) but is only hit once a day, then it is not worth investigating. However, if the same code path is hit a lot (e.g. a million times a day) then it is definitely worth investigating.
At this point I had two culprits in mind. We have already established the application in question does a lot of image processing. But there are a few moving parts and two ways of kicking off the image processing:-
After that we transform the image and then upload it to AWS S3. At this stage I was
leaning towards the SFTP, as it probably needed to verify each chunk it
received from the server. But following my hunches has lead me on a wild
goose chase before so ignoring my hunch I plugged
chunk-signature into Google and smashed enter. Google
pointed to AWS S3 as the
culprit. But that is just theory, we need to prove that.
public class UploaderV1 : IUploader
{
    private readonly AWSCredentials _credentials;
    private readonly RegionEndpoint _region;
    private readonly string _bucketName;

    public UploaderV1(AWSCredentials credentials, RegionEndpoint region, string bucketName)
    {
        _credentials = credentials;
        _region = region;
        _bucketName = bucketName;
    }

    public void Upload(Stream objectToUpload, int iteration)
    {
        try
        {
            using (var client = new AmazonS3Client(_credentials, _region))
            {
                var putObjectRequest = new PutObjectRequest
                {
                    BucketName = _bucketName,
                    Timeout = TimeSpan.FromSeconds(5),
                    InputStream = objectToUpload,
                    Key = "v1/" + iteration + ".png",
                    CannedACL = S3CannedACL.PublicRead,
                    StorageClass = S3StorageClass.Standard,
                    ServerSideEncryptionMethod = ServerSideEncryptionMethod.None,
                };

                client.PutObject(putObjectRequest);
            }
        }
        catch (Exception exception)
        {
            Console.WriteLine(exception);
        }
    }
}
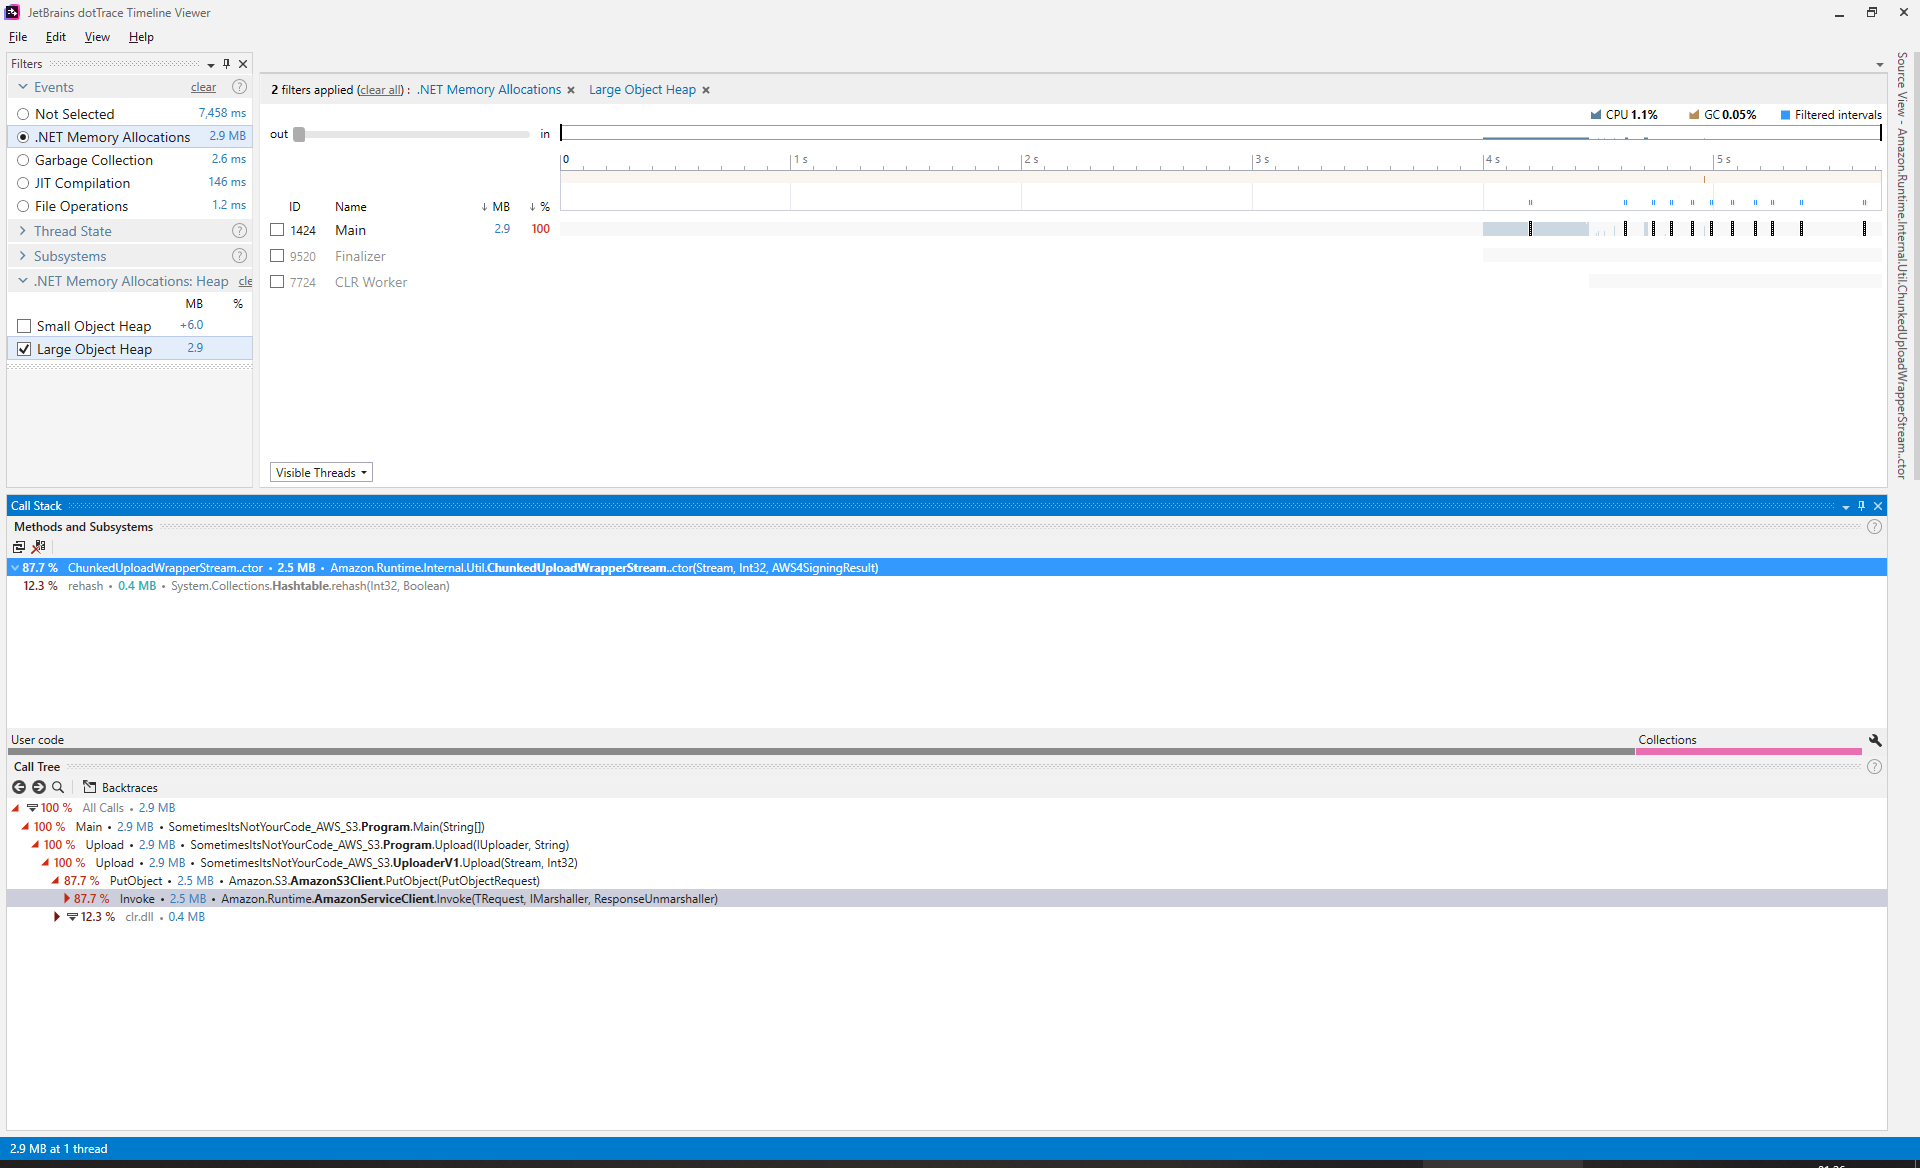
If we upload the same image ten times and use dotTrace to view the LOH we see an interesting pattern:-

It looks like every time we call PutObject on the AWS S3
.NET client there is a fixed cost of 0.3 MB. This is a
problem because it means every time you use PutObject, you
are paying a high cost of 0.3 MB per upload. Just to make
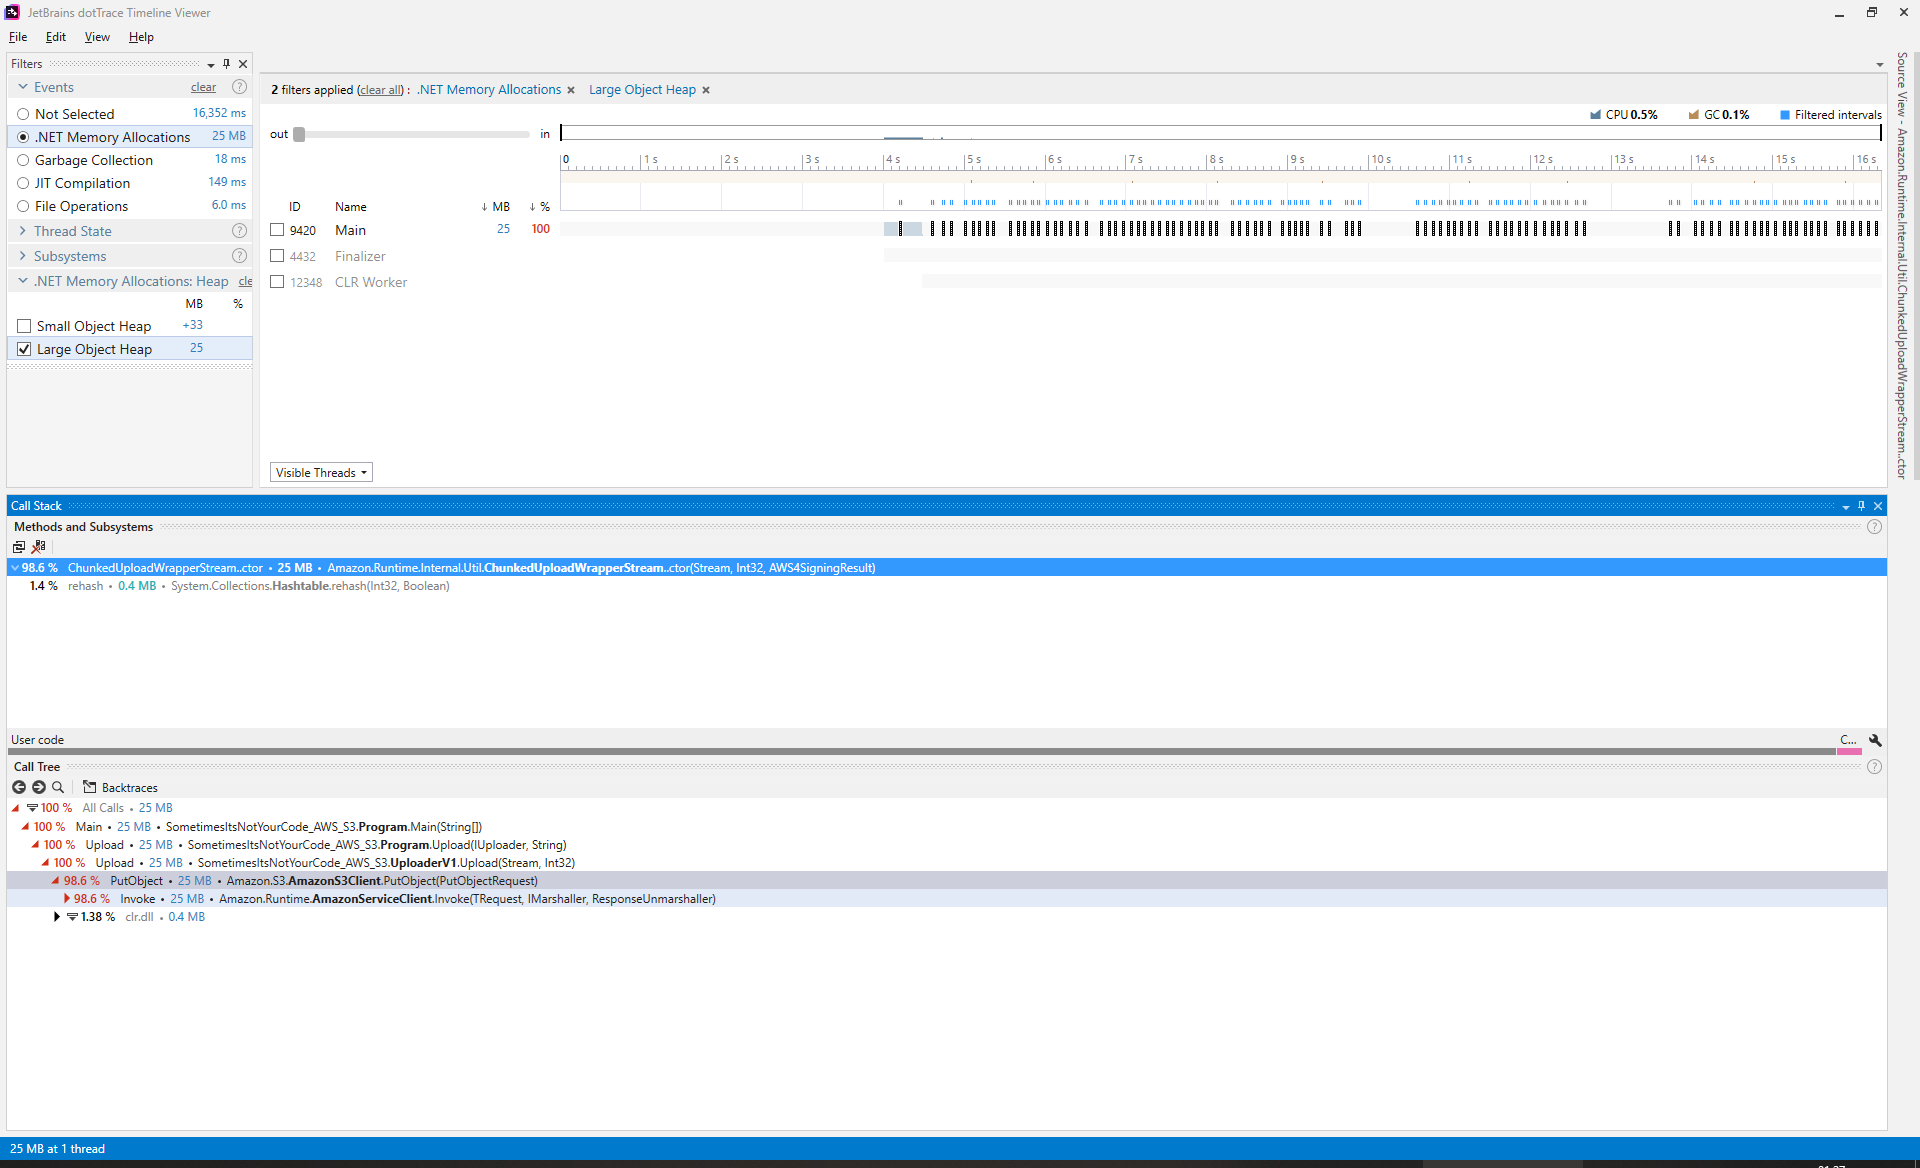
sure; what happens if we increase the number of times we upload from ten
times to one hundred times?

Yes, we can definitely say that for every invocation of
PutObject a costly allocation of 0.3 MB is
made. Going one step further and dumping the process using ProcDump:-
procdump64.exe -ma -64 AWS-S3.exeRunning the dump file through ADA we see the exact same
characteristics of there being two groups of byte[] arrays;
50% have a length 131,096 and the other 50% have a length
of 131,186. Half the files are images when renamed, and
half the files have the chunk-signature starting line. At
this point we are certain that the AWS S3 .NET client is allocating
byte[] arrays directly onto the LOH; and that is a
problem.
The LOH is a region of memory that is collected but never compacted - though as of .NET v4.5.1 compaction is now possible - word of warning compaction of the LOH is expensive; around 2.3 milliseconds per megabyte. A good rule of thumb is that short-lived objects should never make it onto the LOH.
Objects that are equal to or greater than 85,000 bytes go straight onto the LOH. The LOH operates very differently from other regions of memory. Other regions of memory get collected and compacted regularly meaning that you can just add new objects to the end after the garbage collector runs. Whereas the LOH tries to fit newly allocated objects in free space left after dead objects are discarded. This works fine if the newly allocated object is the exact same size or smaller as the free space. If a space can not be found then the LOH has to grow to accommodate that object.
It helps to think of it like a bookshelf; in other regions of memory, books that are no longer used are simply thrown away and the remaining books are pushed together and any new books go at the end of the book shelf.
Within the LOH that is not possible, instead books (objects) are thrown away, and the number of pages that used to be in that space (bytes) is recorded and the next time a book gets allocated to the that shelf (the LOH) it attempts to find an empty space that can hold that many pages (bytes). If the shelf can not accommodate the newly allocated book (object) then the shelf must be extended to hold that new book (object).
The garbage collector will collect dead objects from the LOH, and in
the mean time new objects are being allocated to the LOH. This can lead
to a situation over a lifetime of a long running application where the
LOH size has grown to a few gigabytes (because new objects did not fit
into existing empty space) but actually only contains a few alive
objects. This is known as LOH fragmentation. We were extremely
lucky in this situation as the byte[] arrays that made it
onto the LOH had two sizes; 131,186 and
131,096. This means that as old objects of either size died
and were collected, newly allocated objects were just the right size to
slot right into the empty space.
Okay, back to the fun stuff.
Thanks to dotTrace we were able to establish exactly what was causing
the LOH fragmentation. It also showed us that the fixed cost of
0.3 MB per invocation of PutObject happened
inside of the constructor for
ChunkedUploadWrapperStream:-
A quick visit to that
file in aws-sdk-net repository. Shows that two byte[]
arrays are created with a length of at least 131,072:-
public class ChunkedUploadWrapperStream : WrapperStream
{
    public static readonly int DefaultChunkSize = 128*1024;
    private byte[] _inputBuffer;
    private readonly byte[] _outputBuffer;

    // truncated for brevity

    internal ChunkedUploadWrapperStream(Stream stream, int wrappedStreamBufferSize, AWS4SigningResult headerSigningResult) : base(stream)
    {
        // truncated for brevity
        _inputBuffer = new byte[DefaultChunkSize];
        _outputBuffer = new byte[CalculateChunkHeaderLength(DefaultChunkSize)];
    }

    // truncated for brevity
}
This is exactly why these byte[] arrays are allocated
directly to the LOH, they are above the LOH threshold
(85,000 bytes). At this point there are a few possible
solutions:-
byte[] arrays from a pool of
byte[] arraysStream’sDefaultChunkSize so that consumers of the API
can set it themselvesDefaultChunkSize to a number that is below LOH
threshold (85,000 bytes)The first and second solutions are probably the ones with the biggest wins to be had, but that would require a large pull request and introducing a dependency that the library maintainers might not want2. The third solution means that the consumers of the library have to know about the problem and set it to a reasonable number to avoid LOH allocations. No, it seems like the fourth solution is the most likely to get accepted and has the least possibility of breaking existing functionality.
All we need is a number that is lower than 85,000,
normally something like 84,000 would have been perfectly
suitable. However, a few weeks prior to discovering this problem I was
poking around Reference
Source (investigating a different issue) when I stumbled across this
gem:-
// We pick a value that is the largest multiple of 4096 that is still smaller than the large object heap threshold (85K).
// The CopyTo/CopyToAsync buffer is short-lived and is likely to be collected at Gen0, and it offers a significant
// improvement in Copy performance.
private const int _DefaultCopyBufferSize = 81920;
Windows memory pages are 4,096
bytes in size, so picking a multiple of that which falls under the
LOH threshold (85,000 bytes) makes complete sense. Time to
fork, branch, create an
issue, and make a pull request.
Luckily, we can make the change locally3 and see what the
benefits are. Statistics for one hundred uploads of the same image via
PutObject:-
| Version | Total Memory Allocations | SOH | LOH |
|---|---|---|---|
| 1 (DefaultChunkSize at 131,072) | 59 MB | 33 MB | 25 MB |
| 1 (DefaultChunkSize at 81,920) | 51 MB | 51 MB | 0.4 MB |
Whilst waiting for my pull request to be reviewed I decided to poke
around the AWS S3 documentation and I stumbled across the concept of pre-signed
URLs. That sounds interesting! Creating V2 of the
uploader:-
public class UploaderV2 : IUploader
{
    private readonly AWSCredentials _credentials;
    private readonly RegionEndpoint _region;
    private readonly string _bucketName;

    public UploaderV2(AWSCredentials credentials, RegionEndpoint region, string bucketName)
    {
        _credentials = credentials;
        _region = region;
        _bucketName = bucketName;
    }

    public void Upload(Stream objectToUpload, int iteration)
    {
        try
        {
            using (var client = new AmazonS3Client(_credentials, _region))
            {
                var request = new GetPreSignedUrlRequest
                {
                    BucketName = _bucketName,
                    Verb = HttpVerb.PUT,
                    Expires = DateTime.Now.AddMinutes(5),
                    ServerSideEncryptionMethod = ServerSideEncryptionMethod.None,
                    Key = "v2/" + iteration + ".png",
                    Headers = { [HeaderKeys.XAmzAclHeader] = S3CannedACL.PublicRead.Value }
                };

                var preSignedUrl = client.GetPreSignedURL(request);
                var webRequest = WebRequest.CreateHttp(preSignedUrl);
                webRequest.Method = WebRequestMethods.Http.Put;
                webRequest.ContentType = "image/*";
                webRequest.AllowWriteStreamBuffering = false;
                webRequest.ContentLength = objectToUpload.Length;
                webRequest.Headers[HeaderKeys.XAmzAclHeader] = S3CannedACL.PublicRead.Value;

                using (var dataStream = webRequest.GetRequestStream())
                using (objectToUpload)
                {
                    objectToUpload.CopyTo(dataStream, objectToUpload.Length > 81920 ? 81920 : (int)objectToUpload.Length);
                }

                using (webRequest.GetResponse())
                {

                }
            }
        }
        catch (Exception exception)
        {
            Console.WriteLine(exception);
        }
    }
}
We see it has the following statistics when uploading the same file one hundred times:-
| Version | Total Memory Allocations | SOH | LOH |
|---|---|---|---|
| 1 (DefaultChunkSize at 131,072) | 59 MB | 33 MB | 25 MB |
| 1 (DefaultChunkSize at 81,920) | 51 MB | 51 MB | 0.4 MB |
| 2 (Using pre-signed URLs) | 17 MB | 17 MB | 0.4 MB |
That is pretty awesome, and all we actually had to do to achieve that gain was read the documentation! Well, not true, you have the benefit of reading a summarised article with all the juicy bits. The work you see here took place over the course of a week, slotted in between client work.
There is a small downside to using GetPreSignedURL in
that if the GetPreSignedUrlRequest is modified and the
WebRequest is not modified accordingly then AWS will return
HTTP 403 Forbidden
(e.g. removing the XAmzAclHeader on the
WebRequest). This is because the client-side hash and the
server-side hashes no longer match.
Thanks to my last
article I have learnt what nerd
sniping is - something I do to myself quite a lot. At this stage I
was feeling that giddiness about what else could be shaved off, I was
wholly looking at the 0.4 MB remaining on the LOH. Again,
dotTrace points us in the direction of code path causing that
0.4 MB allocation to the LOH:-
Yikes, that looks fairly serious. Quietly backing away and trying a different tact; we know a pre-signed URL looks something like this:-
https://##bucket_name##.s3.##region_name##.amazonaws.com/##path##/##file_name##?X-Amz-Expires=300&X-Amz-Algorithm=AWS4-HMAC-SHA256&X-Amz-Credential=##access_key##/20180613/##region_name##/s3/aws4_request&X-Amz-Date=20180613T233349Z&X-Amz-SignedHeaders=host;x-amz-acl&X-Amz-Signature=6bbcb0f802ad86022674e827d574b7a34a00ba76cd1411016c3581ba27fa5450We should be able to generate that URL ourselves as AWS has very
kindly published their signing
process. At this point I will admit that I was ready to accept
defeat and just leave the 0.4 MB kicking about on the LOH.
I really did not feel like the reams of code I was about to write to
possibly eliminate that remaining 0.4 MB was going
to be worth it.
That was until I spotted an
example of what I wanted. With considerably less effort required on
my part; V3 was born:-
| Version | Total Memory Allocations | SOH | LOH |
|---|---|---|---|
| 1 (DefaultChunkSize at 131,072) | 59 MB | 33 MB | 25 MB |
| 1 (DefaultChunkSize at 81,920) | 51 MB | 51 MB | 0.4 MB |
| 2 (Using pre-signed URLs) | 17 MB | 17 MB | 0.4 MB |
| 3 (Using manually pre-signed URLs) | 13 MB | 13 MB | 0 MB |
V3 was just an experiment to see what was possible,
given how small the gains and how much code there is to maintain it is
not something we would actually use in production code. The discovery of
pre-signed URLs is the main win here;-
| Version | Total Memory Allocations | SOH | LOH |
|---|---|---|---|
| 1 (DefaultChunkSize at 131,072) | 59 MB | 33 MB | 25 MB |
| 2 (Using pre-signed URLs) | 17 MB | 17 MB | 0.4 MB |
| Percentage | -71.18% | -48.48% | -98.4% |
Meanwhile my pull request had been merged
and released in version 3.3.21.19 of AWSSDK.Core.
Quick overview of the timeline:-
AWSSDK.Core released to
NuGetI love open source.
Versions of AWSSDK.Core below 3.3.21.19
caused a fixed cost of 0.3 MB per invocation of
PutObject on the AWS S3 .NET client. This was rectified in
versions 3.3.21.19 and above. For particularly hot code
paths, it is worth exploring the use of GetPreSignedURL on
the AWS S3 .NET client as that dropped LOH allocations by 98% in our
context and use case.
1 Another reason may be that WinDbg still scares me.
2 That being said a recent conversation has been started to take advantage of .NET Core goodness
3 Make sure to build in release unlike a certain someone - okay it was me
Tweet![]()